123 dramatically improves first-year retention
Okay, here’s a nice picture:
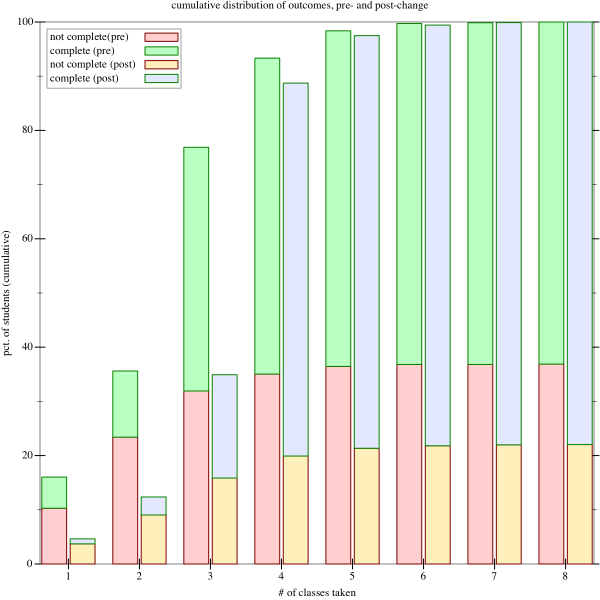
first-year retention pre- and post-change
This compares the outcomes in the years 2005 through 2009, before we instituted 123, with the outcomes in the years since. This is a cumulative graph, showing for a number of classes how many students finished by taking that many classes or fewer, and whether they succeeded or failed. Success is defined as having gotten a grade of C- or better in 103 (that is, the condition that allows them to continue with higher-level classes in the major).
So, for instance, we see that in the years before 123 was added, more than 90% of students took four classes or fewer, and that about 38% of those students did not successfully finish. In the years after 123 was added, slightly less than 90% of students took four classes or fewer, and of those, only about 23% left without finishing.
The big picture here is the post-change years have a much lower dropout rate; our first-year retention has improved from 63% to 77%, a dramatic increase.
Here’s a related picture:
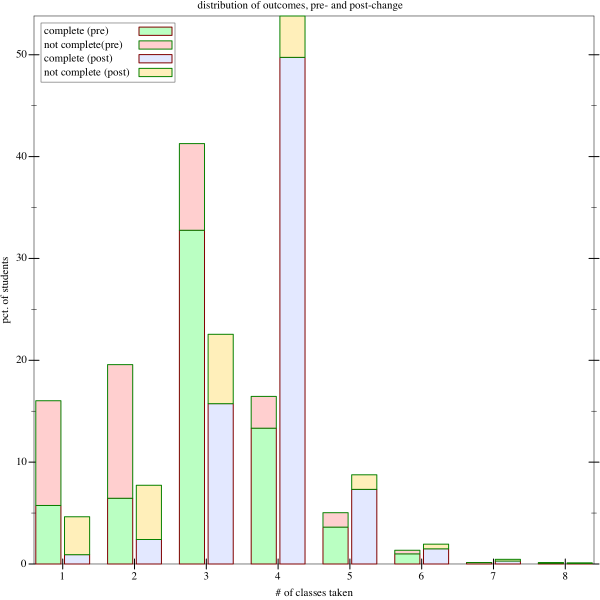
first-year retention pre- and post-change
This is just the non-cumulative version of the previous graph, showing how many students took exactly N classes. This graph makes it easier to see where it is that students dropped out of the program. What we see is that before the change, a huge slice of students dropped out after one or two classes (presumably 101 & 102 or 101 & 101). After the change, though, the largest chunk of students drop out after their third class, likely 102.
Resource Usage
A related analysis asks how much work it takes to educate a first-year student. Does the institution of 123 consume huge resources?
There are two ways of answering this question, depending on whether you consider the outcome of the first-year program to be “a student that knows the 103 material” or “a student that has completed N credits.” The first analysis penalizes us for adding a course at the beginning of the sequence, the second one does not.
Using the first lens, we can ask how many SCUs are required to produce one successful first-year student. In the pre–123 world, the answer is 17.76. In the post–123 world, the answer is 18.60. By this measure, educating a student costs about 5% more.
However, in the post–123 world, a student finishing 103 has completed 16 SCUs, rather than 12. So, if we instead compute the excess SCUs taught to the SCUs completed, we get 5.76 excess SCUs taught in the pre–123 world, representing an additional overhead of 47.98%, whereas in the post–123 world, we have only 2.6 excess SCUs, for an overhead of 16%.
Other Factors
One major missing element in this analysis is change made to 101 in the last two years (?), where 101 was completely overhauled. It’s hard to say what effect this has had on student success, but it could definitely have lowered the dropout rate for 101.
Source Data
The source data for this analysis comes from grades earned by students in the years 2005–2016 for students that were CSC, SE, and CPE majors at any point during that time. For the analyses shown here, students starting in Winter 2015 and later were omitted, since they haven’t yet had time to complete the first-year sequence.
Tools
All analysis done using Racket.