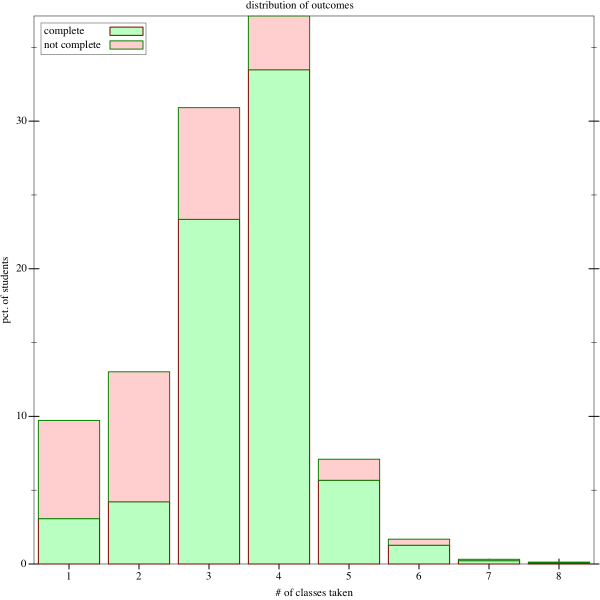
first-year outcomes by # of classes taken
Here’s a pair of pictures showing the distribution of # of classes taken in the first-year curriculum. There are only four classes, so this is really a picture of students repeating classes, and how many times they repeat them. So, for instance, we see that about 8% of students take exactly five courses (most likely repeating one), and that in this group, approximately 85% are then finished successfully.
first-year student outcomes
This graph shows the cumulative distribution; it’s just the discrete integral of the prior picture.
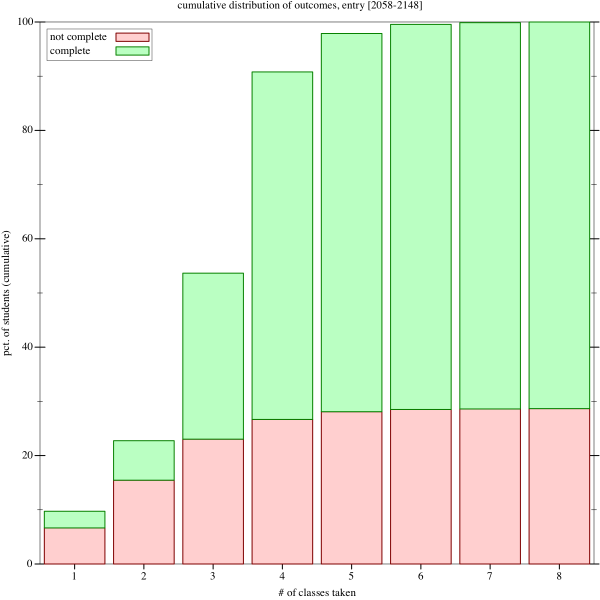
cumulative first-year student outcomes
Note that a lot of people come in with AP credit, and skip one or more classes, which is why we see a lot of people finished after one or two classes.
It’s also interesting how many people stop after one or two classes. You can look at that either as bad news or good, depending on whether you see these students as promising ones that we squandered, or students that quickly discovered that computer science was not for them.
Also note that since these pictures span 2005 to 2015, they cover the period from 2005–2010 when the course sequence was only three courses long. The obvious next step is to split these graphs into two graphs, to see whether the addition of 123 to the curriculum had a major effect.
All analysis done in racket, naturally.
All analysis code (though not the source data) available as part of this github repo.